Intro
Lately, I have been looking at Azure dashboards to provide a quick overview of services running in Azure. In this post, I want to show you how to create a dashboard showing the state of virtual machines, S2S VPN connections, and network peerings.
Azure Resource Graph Explorer (RGE)
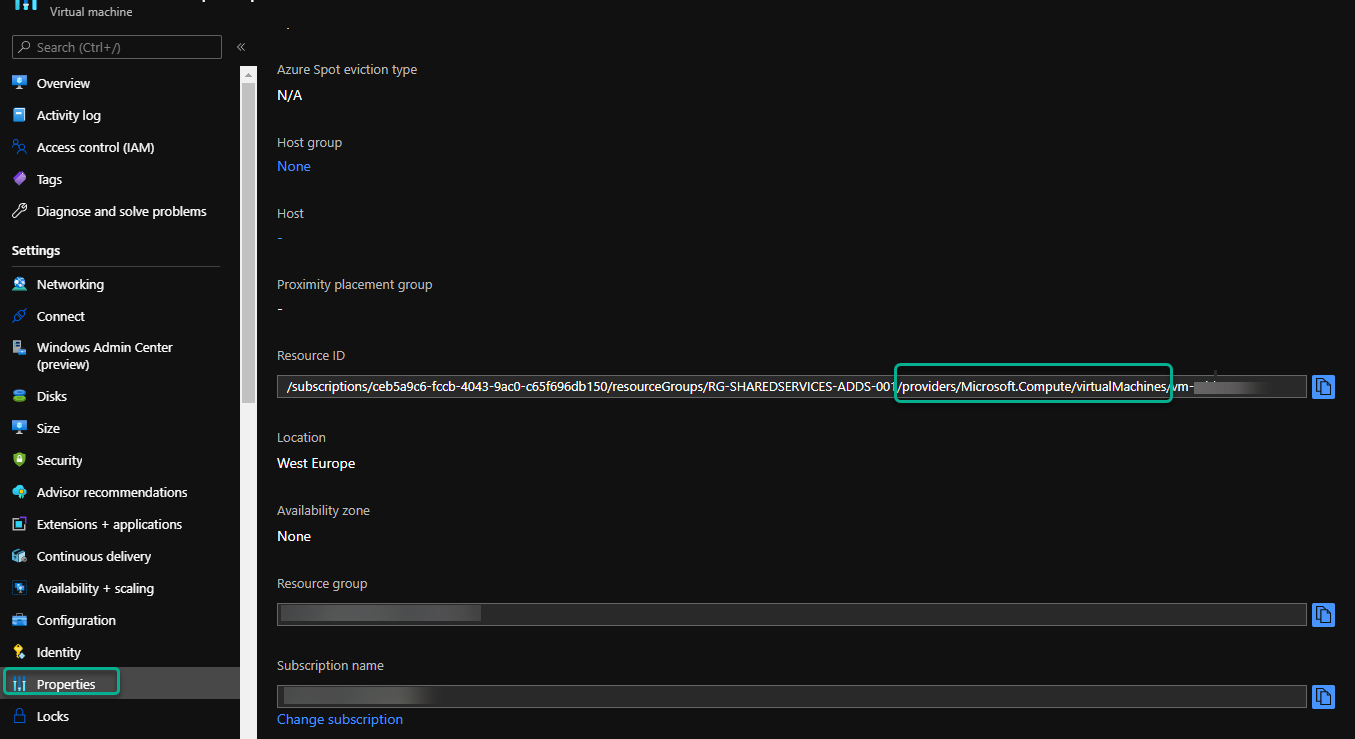
The base for the dashboards in this post is RGE. I will create some queries to generate the data I want to show on my dashboard. RGE is a Kusto Query Language tool that allows you to query your Azure resource with lightning speed. You could find all the information with PowerShell or another tool, but using RGE is a lot faster. One important thing to remember is that RGE queries are case-sensitive, so check the casing if your results are not as expected. To query my VMs, I need to find which table contains information about VMs. I can see this table by going to a VM in the portal and selecting “Properties.” The portal will now show me the “Resource ID,” In that context, I can find the table name right after “/providers/.” In this case, the table I need to query will be “Microsoft.Compute/VirtualMachines.”
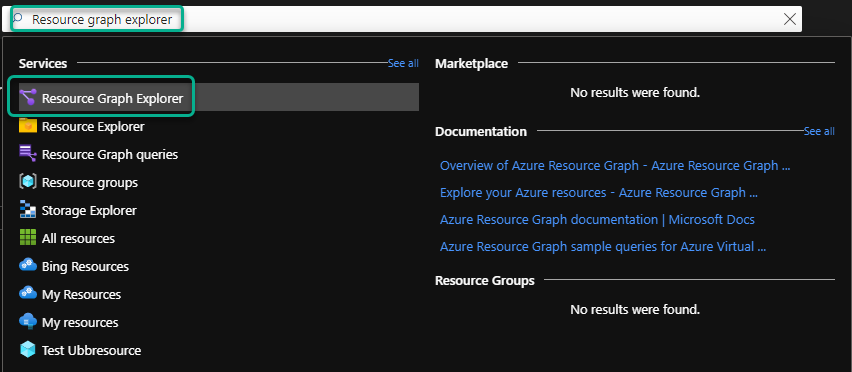
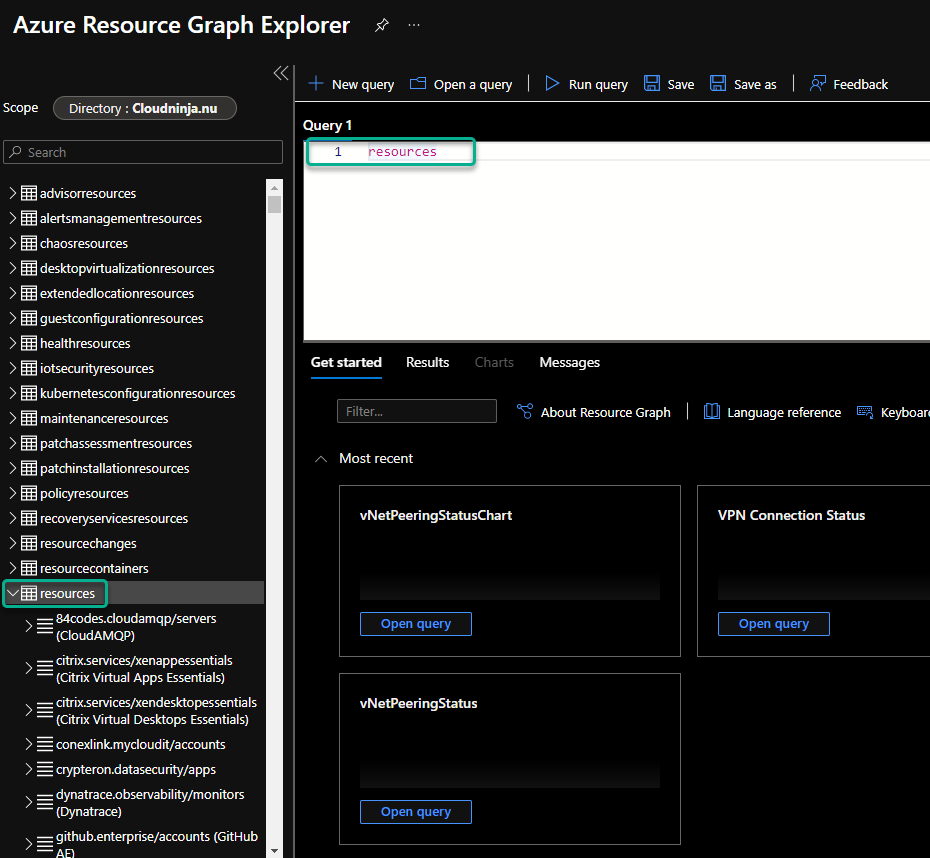
To open RGE, I will use the search field and search for it.
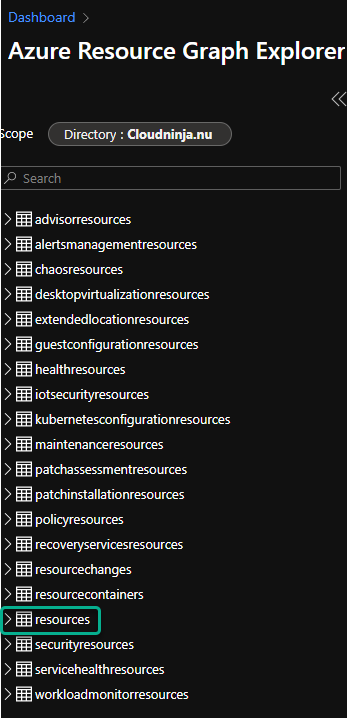
For this blog post, all the queries I will make will be against the category called “resources.”
Virtual machine dashboard
I know that the VM is a resource, so under the RGE, I click and then expand the “resources” table. When I click the table, it will be pasted into the query window.
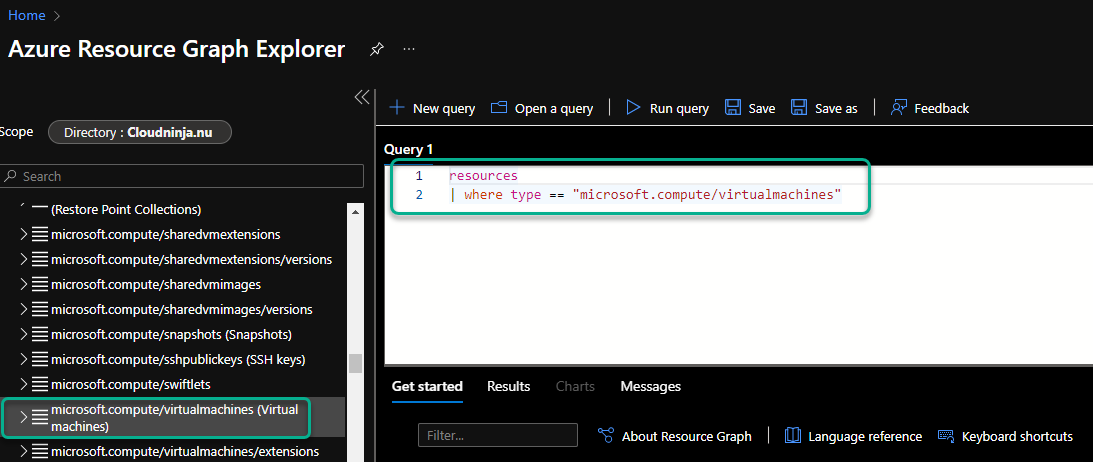
I can now scroll down to “microsoft.compute/virtualmachines,” as this was the table I found in the previous section. I click on the table, and it will be pasted into the query window.
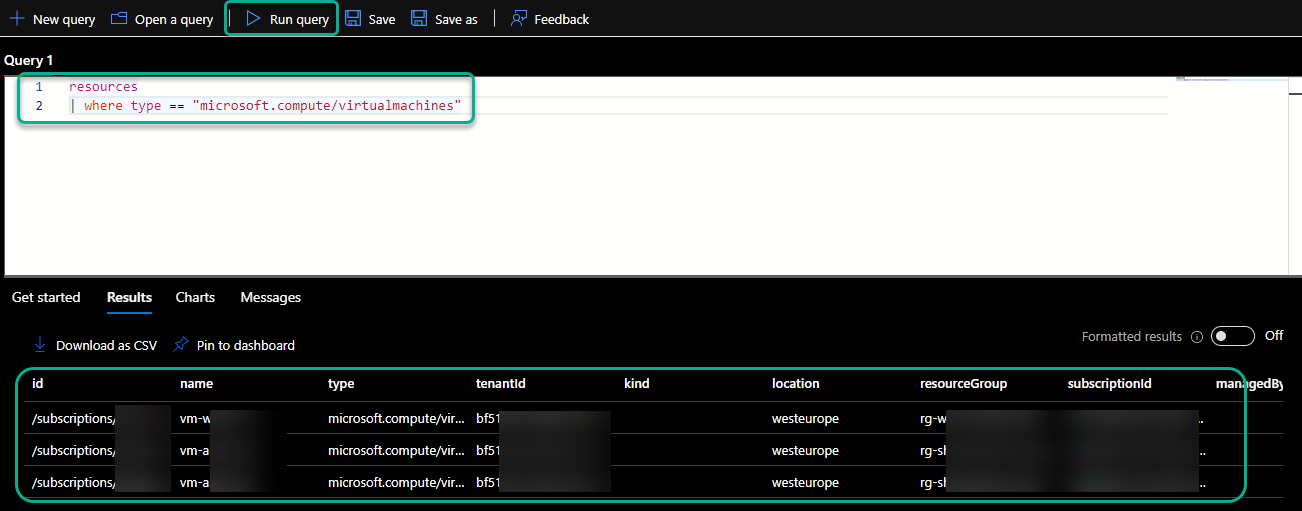
I can run the query and get a list of my VMs.
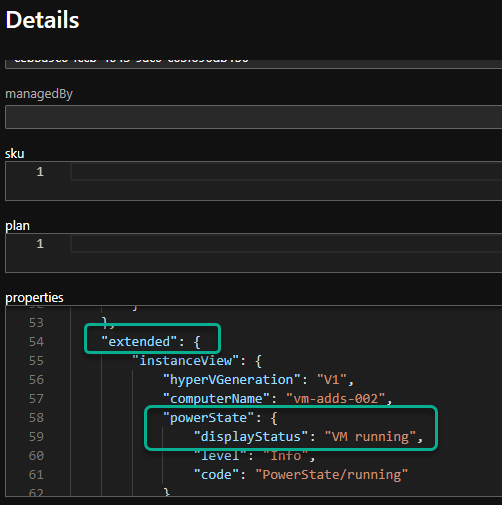
I can now scroll to the right and find the “See details” link. If I click on the link, I can see more information about my VM. If I scroll down to the “extended” section, I can see that the “instanceView” has information on the power state of the VM, and this is the information I want to show in my dashboard.
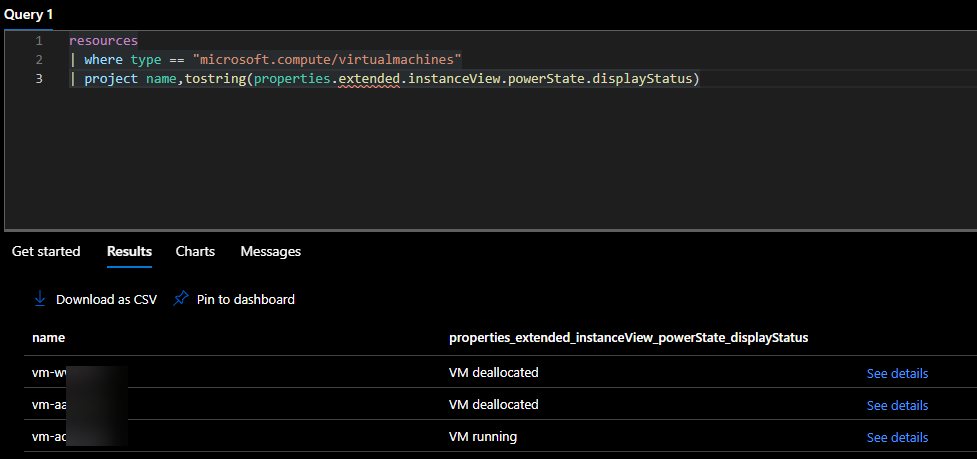
With this information, I can now update my query to ask for the specific items I want to show in my dashboard. I want to keep it simple, so I only wish to add the name and the power state of the VM. I use the tostring function and add the path to the information I need.
resources
| where type == "microsoft.compute/virtualmachines"
| project name,tostring(properties.extended.instanceView.powerState.displayStatus)
When I run the query, it will return the result below.
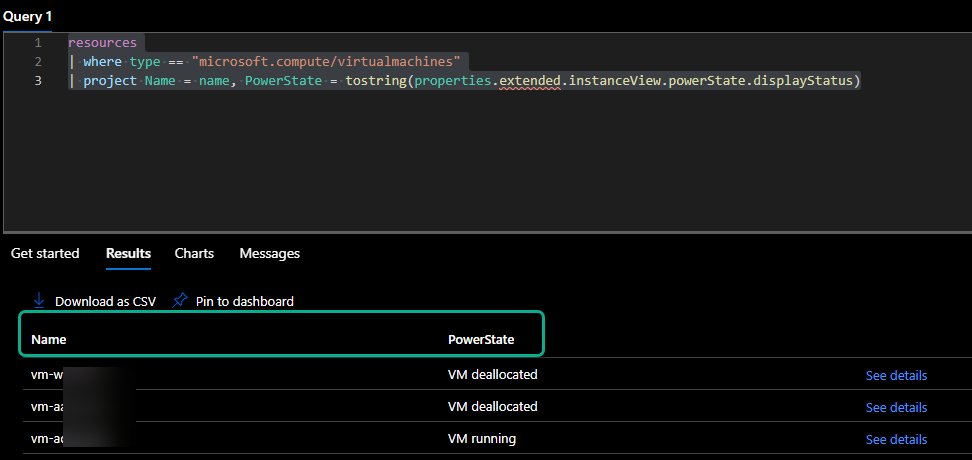
I’m not too fond of the column name for the power state, so I will modify my query a bit to return something that makes more sense.
resources
| where type == "microsoft.compute/virtualmachines"
| project Name = name, PowerState = tostring(properties.extended.instanceView.powerState.displayStatus)
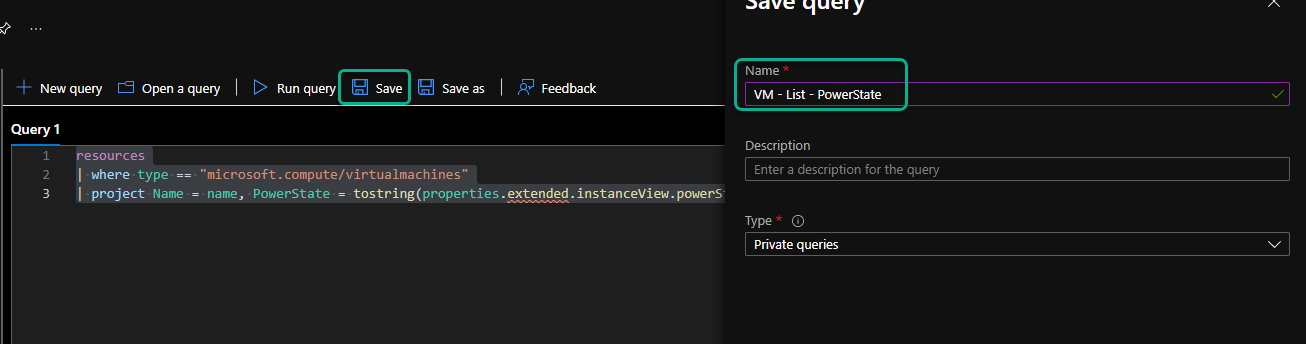
I will save my query to reuse it later on if needed.
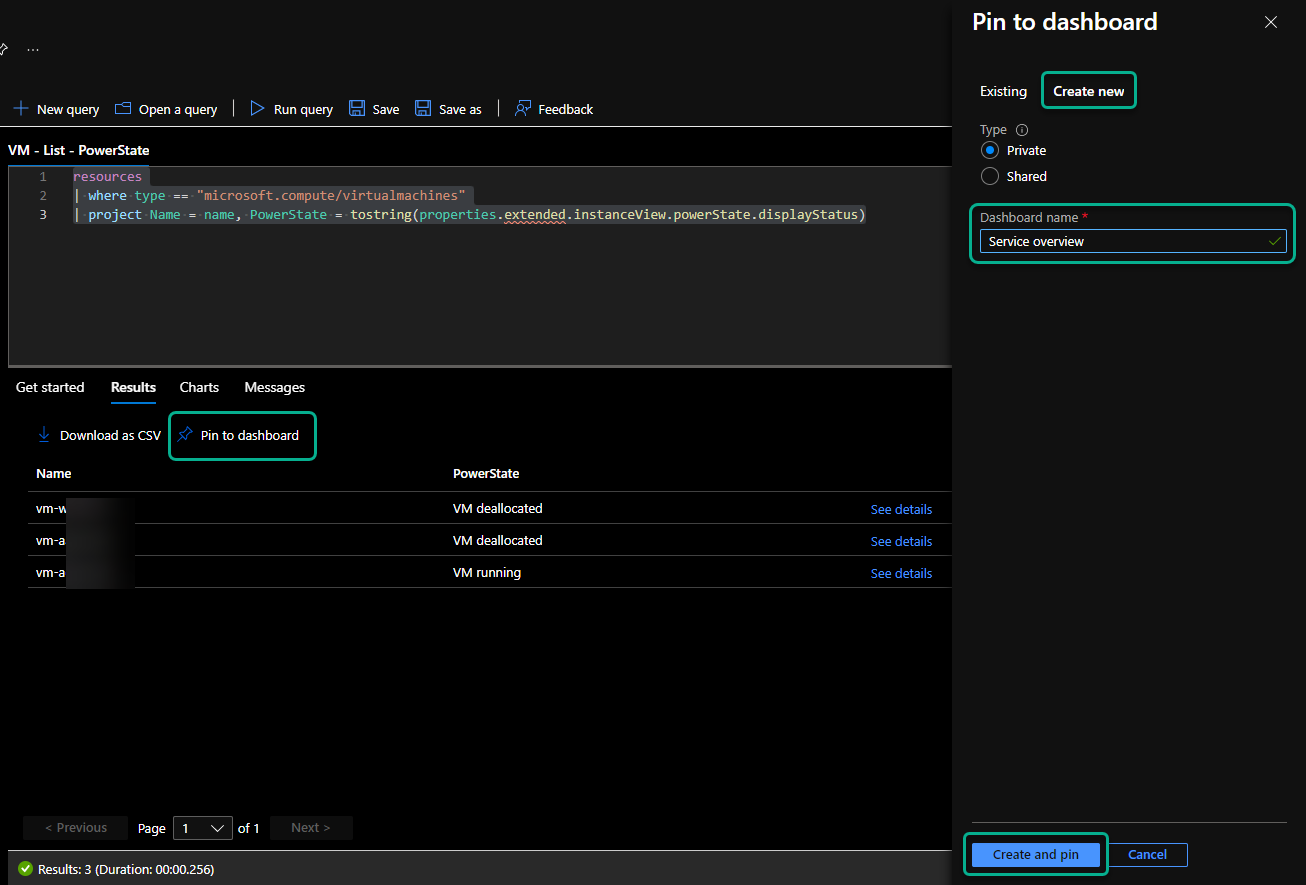
I will now pin the query to a new dashboard. I do this by clicking on “Pin to dashboard,” selecting “Create new,” I chose a “Private” dashboard and named it “Service overview.” The last thing to do is click on “Create and pin.”
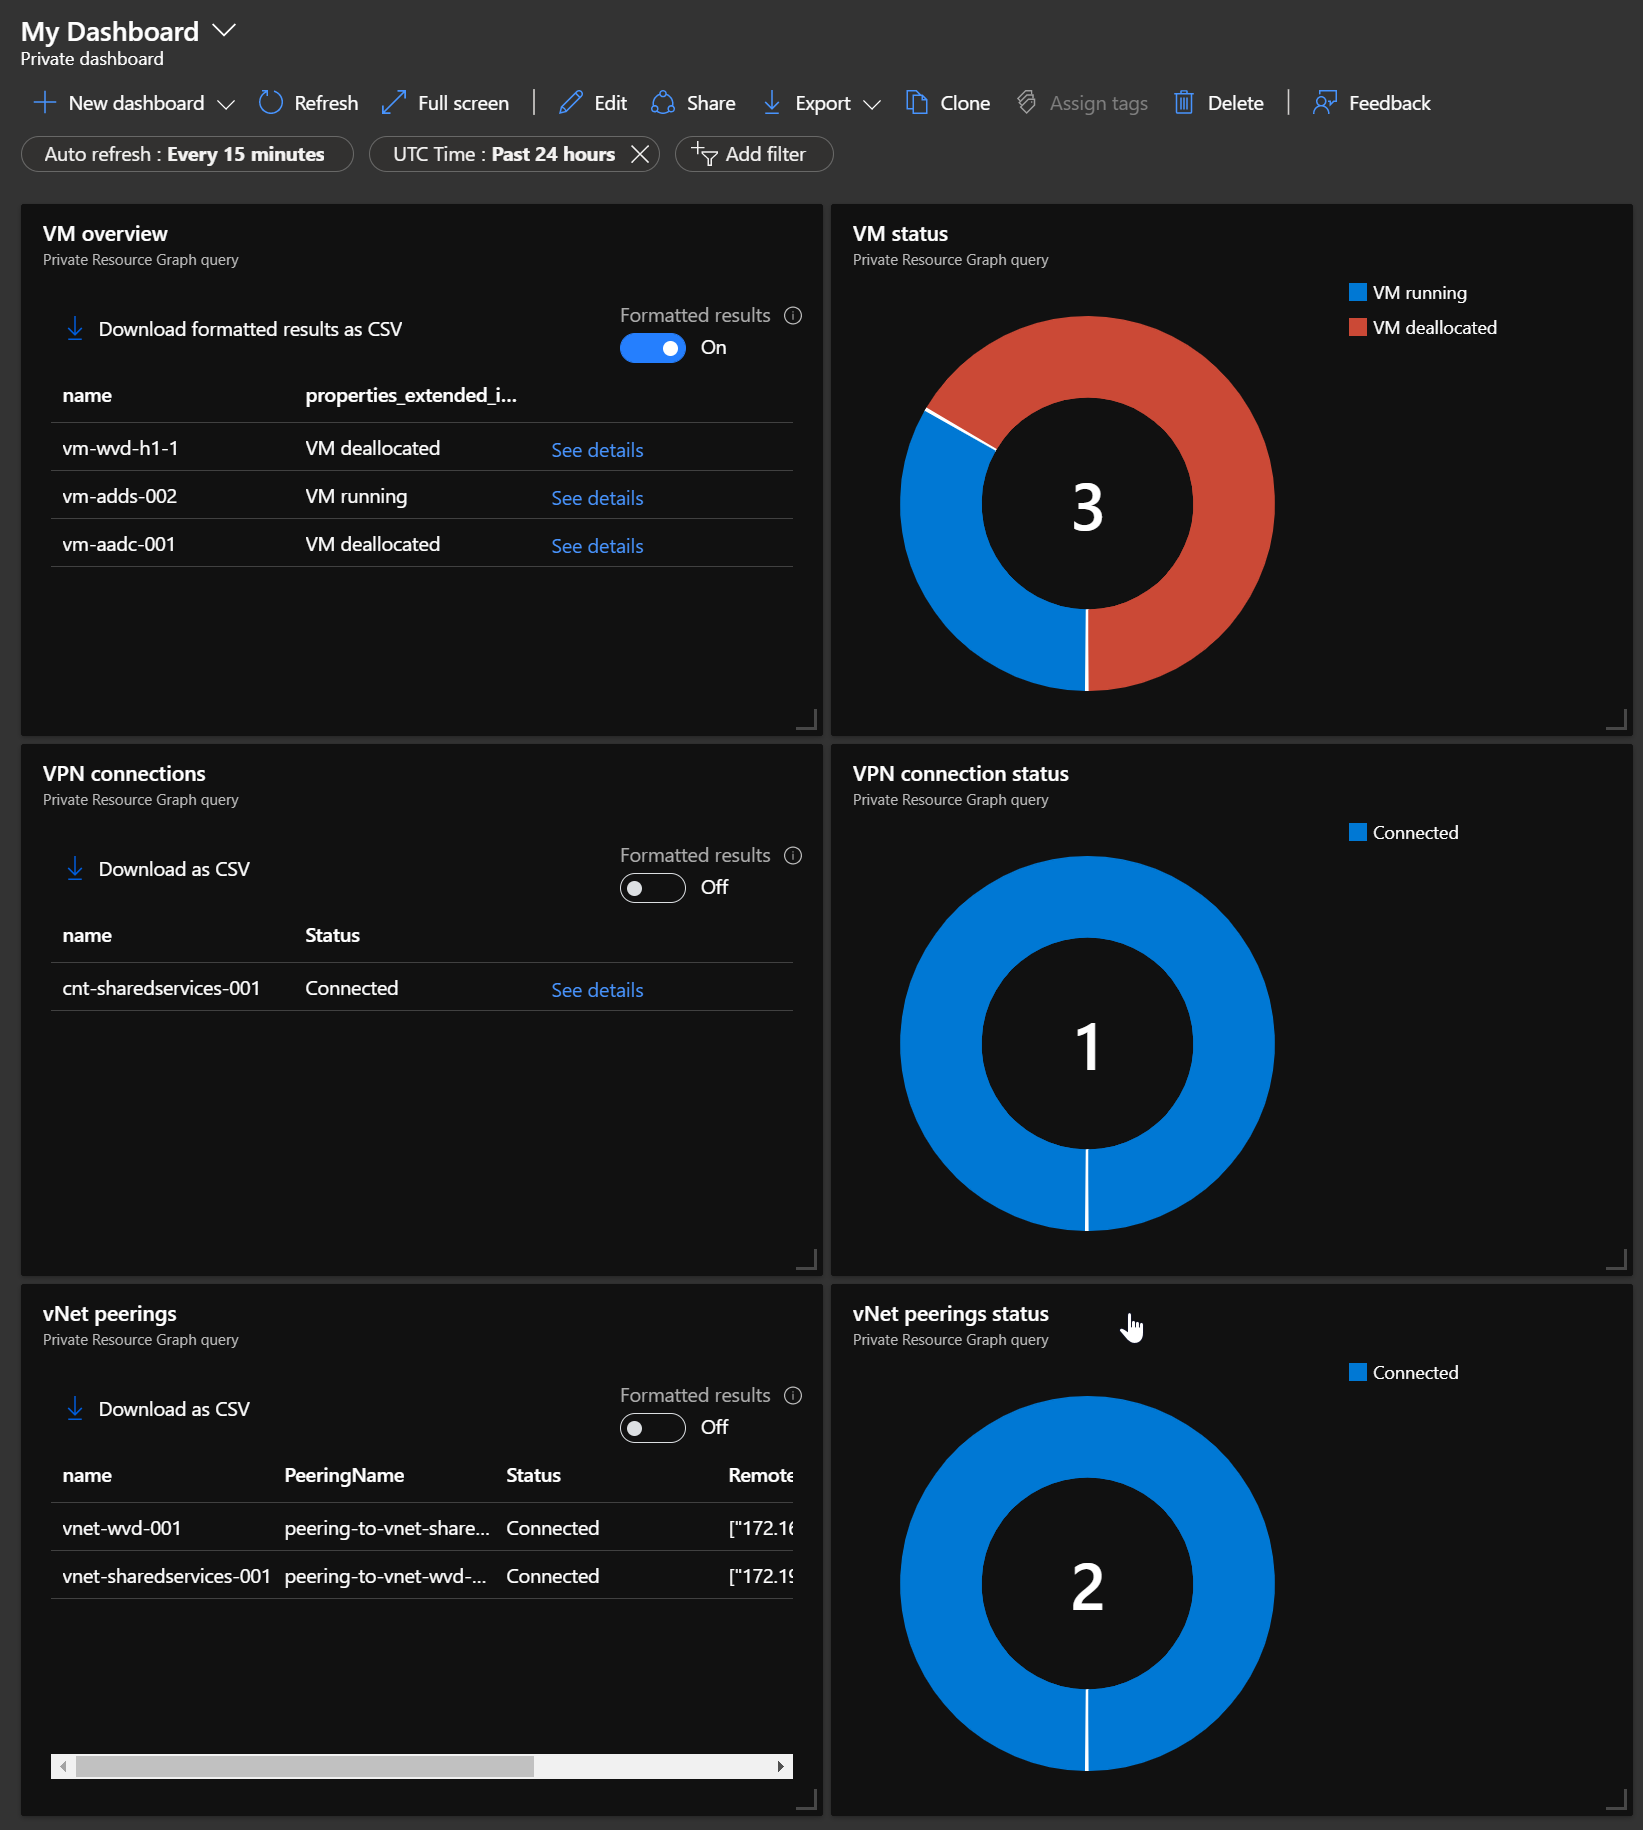
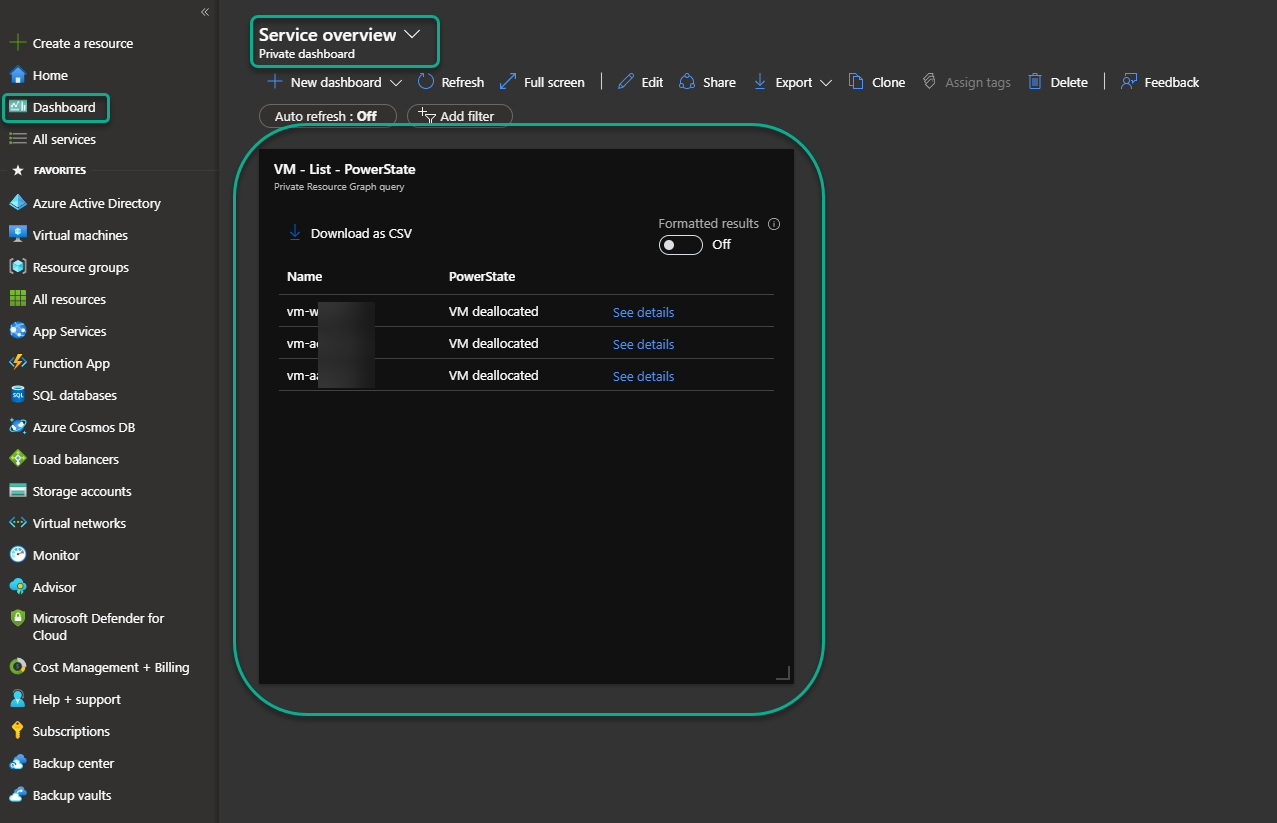
I browse to dashboards and select the “Service overview” I just created, and it now shows me the status of my virtual machines on a dashboard.
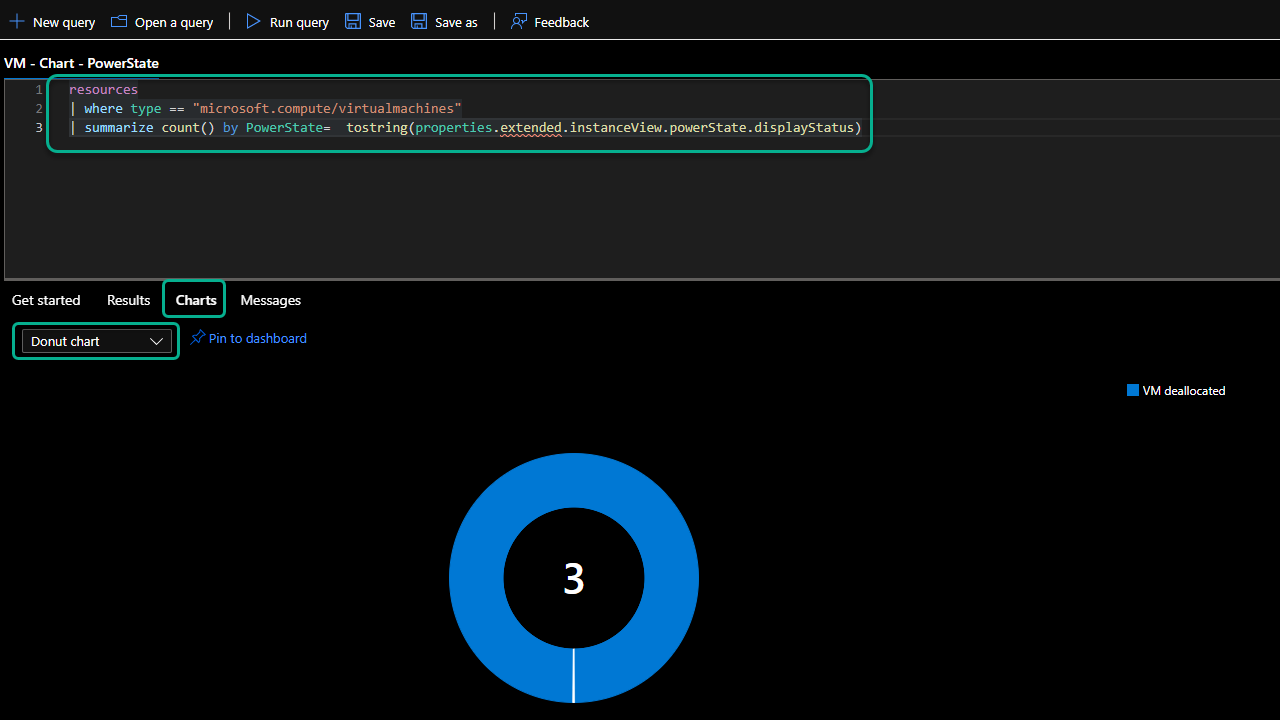
I want to add another VM view to my dashboard, so I will create a summary of my VMs with power state and create a donut chart in my query. The process is the same as before, so I have pasted the new query below.
resources
| where type == "microsoft.compute/virtualmachines"
| summarize count() by PowerState=  tostring(properties.extended.instanceView.powerState.displayStatus)
To make it a donut chart, I can go to the “Charts” section under my query and select “Donut chart.”
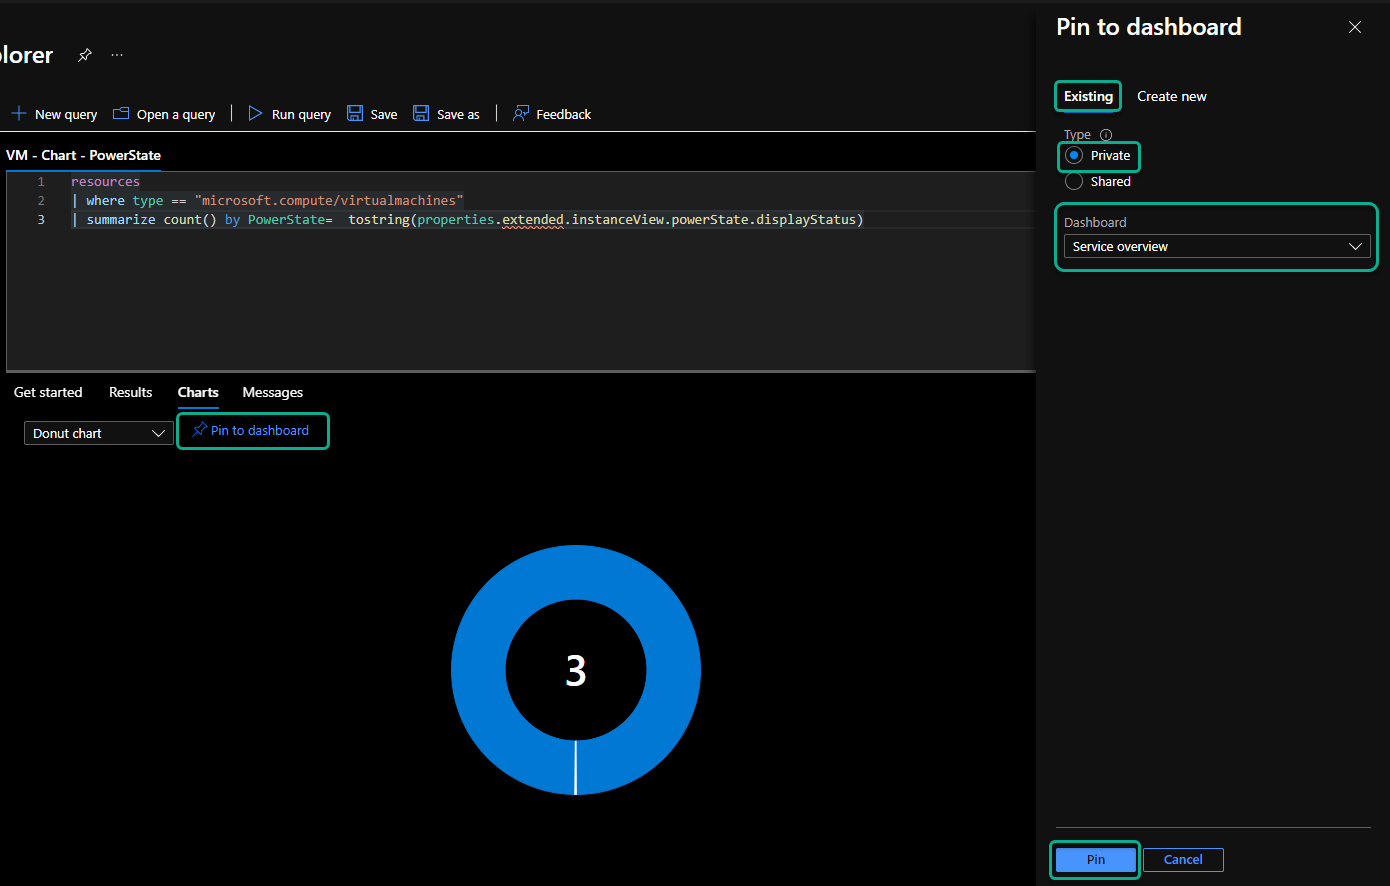
I will save the query and then click on “Pin to dashboard,” select “Existing,” select the “Service overview” dashboard I created earlier and click on “Pin” to add it to the dashboard.
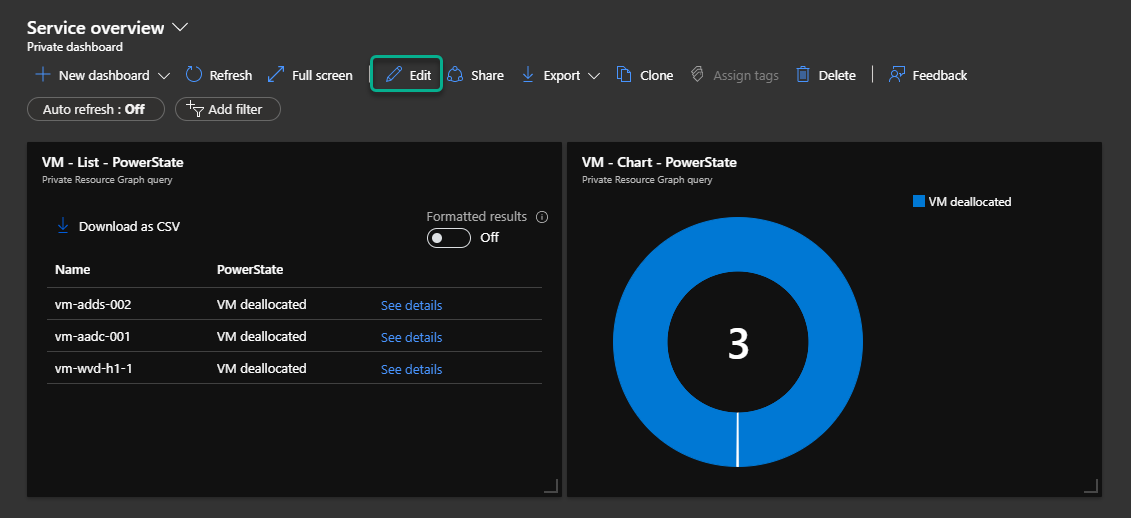
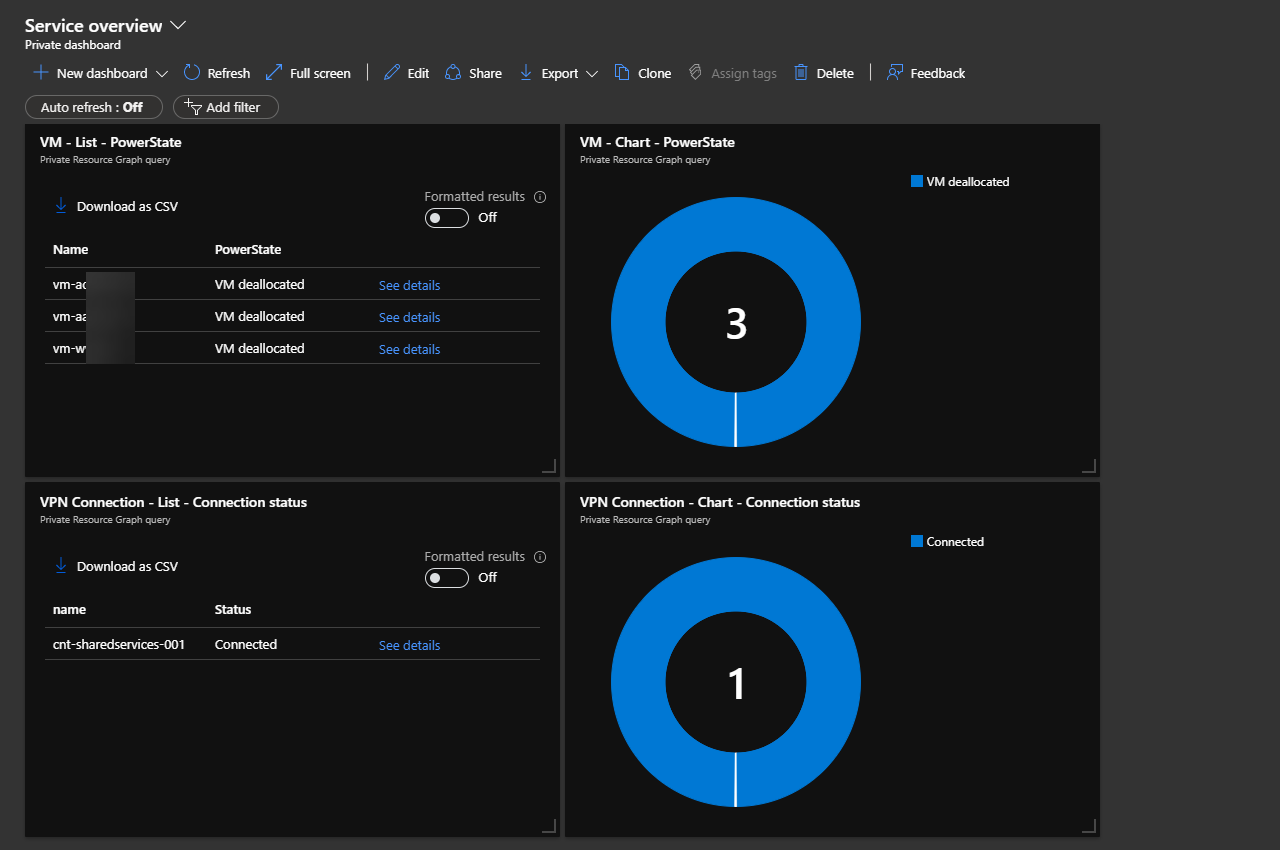
I can now see both the list and chart on my dashboard. I have edited my dashboard to arrange the information side by side and changed the size to 6x4.
VPN connections
The process of adding the VPN connection is the same as the VMs, so I have only pasted in the Kusto Query needed to create the information for the dashboard.
List for VPN Connection status.
resources
| where type == "microsoft.network/connections"
| project name, Status = tostring(properties.connectionStatus)
Chart for VPN connection status.
resources
| where type == "microsoft.network/connections"
| summarize count() by ConnectionStatus = tostring(properties.connectionStatus)
I added it to the dashboard.
Virtual Network Peering
I also wanted to check my vNet peerings, so I have added the Kusto queries below.
List of vNet peerings.
resources
| where type =~ 'microsoft.network/virtualNetworks'
| mv-expand peering=properties.virtualNetworkPeerings
| where peering.properties.peeringState ==  "Connected"
| project name, PeeringName = tostring(peering.name),Status = tostring(peering.properties.peeringState), RemoteAddressSpace = tostring(peering.properties.remoteAddressSpace.addressPrefixes)
Chart for vNet peerings.
resources
| where type =~ 'microsoft.network/virtualNetworks'
| mv-expand peering=properties.virtualNetworkPeerings
| where peering.properties.peeringState ==  "Connected"
| project name, PeeringName = tostring(peering.name),Status = tostring(peering.properties.peeringState), RemoteAddressSpace = tostring(peering.properties.remoteAddressSpace.addressPrefixes)
| summarize count() by Status
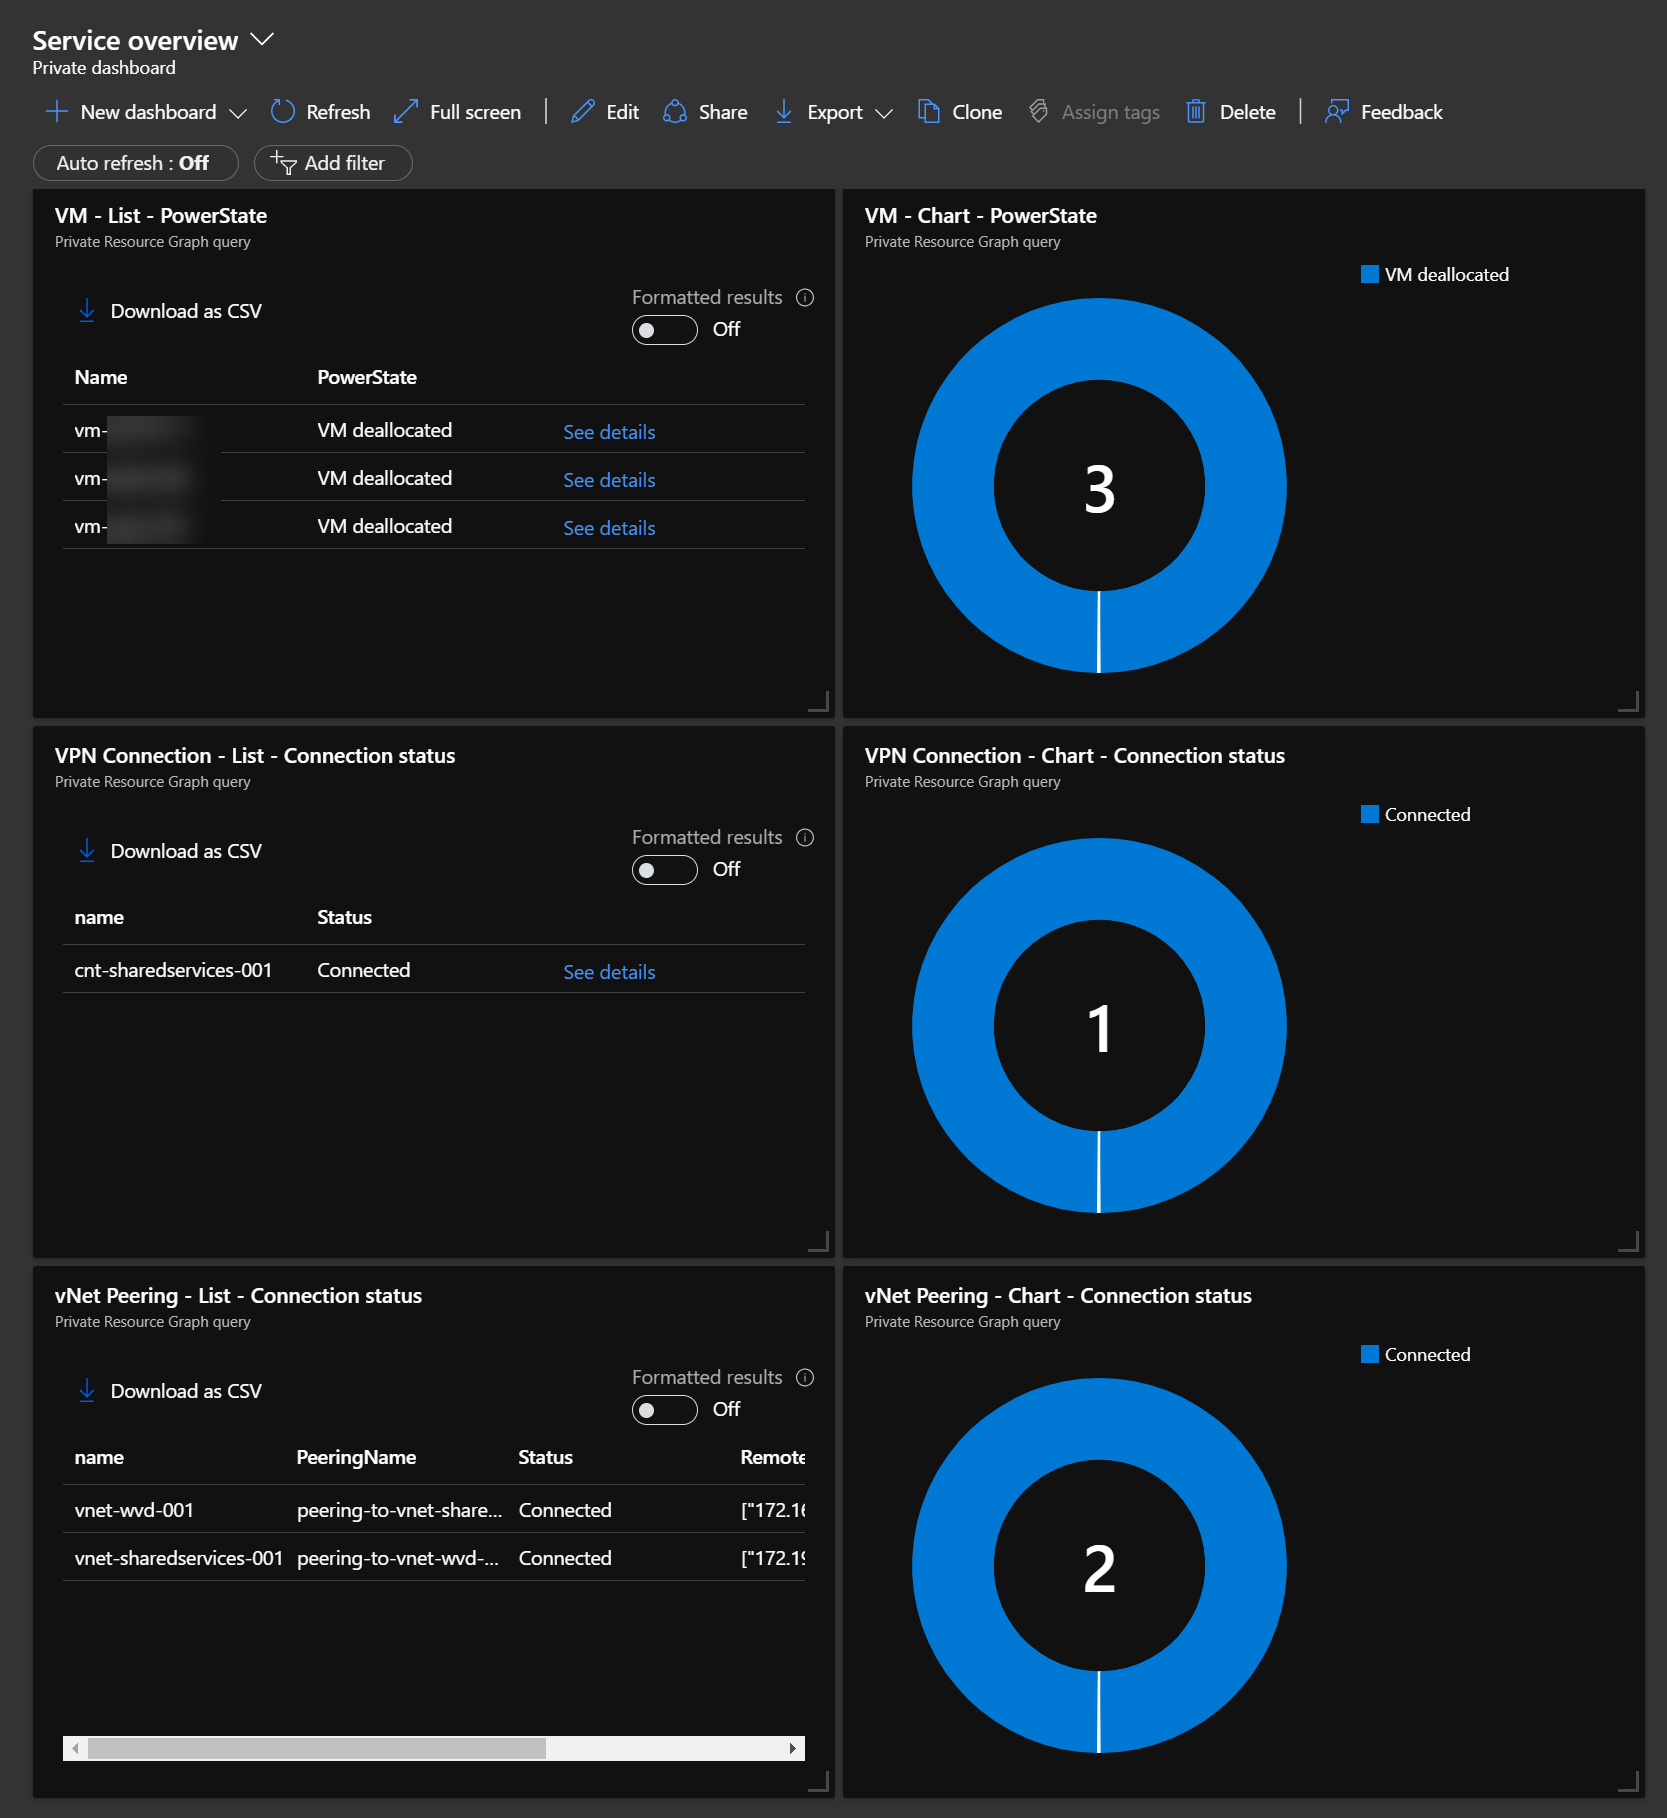
I added it to the dashboard.
Summary
With these services added to my dashboard, I am happy with it for now. I will probably add more services later, like, for instance, my App Services, but that will be a later post if so. As this article has shown, it is easy to create these dashboards, which adds value. I don’t have to click around the portal to find my Azure resource health information. It is right there in front of me.
I hope this post was helpful.
If you have questions or feedback, reach out to me.